pycvcam.display_optical_flow_quiver#
- display_optical_flow_quiver(image1, image2, flow_x, flow_y, region=None, display_region=None, step=10, alpha=0.8, color='black', width=0.002, channel=0)[source]#
Display the optical flow as a quiver plot overlaid on the given images using Matplotlib.
The inuput image is displayed in background blued and the output image is displayed in background reddish. The optical flow is displayed as arrows (quiver) overlaid on the images, where the direction of the arrows represents the direction of motion and the length of the arrows represents the magnitude of motion.
- Parameters:
image1 (ArrayLike) – The first image with shape \((H, W)\) or \((H, W, C)\).
image2 (ArrayLike) – The second image with shape \((H, W)\) or \((H, W, C)\).
flow_x (ArrayLike) – The x-component of the optical flow (horizontal displacement) in pixels with shape \((H, W)\).
flow_y (ArrayLike) – The y-component of the optical flow (vertical displacement) in pixels with shape \((H, W)\).
region (Optional[Tuple[Integral, Integral, Integral, Integral]], optional) – A tuple specifying the region of interest in the format (x, y, width, height). Crop the image to this region before displaying. If None, the entire image is displayed. Default is None.
display_region (Optional[Tuple[Integral, Integral, Integral, Integral]], optional) – A tuple specifying the region of the flow to display in the format (x, y, width, height). Crop the flow to this region before displaying. If None, the entire flow is displayed. Default is None.
step (Integral, optional) – The step size for sampling the flow vectors to display. Default is 10.
alpha (Real, optional) – The alpha blending value for overlaying the optical flow on the images. Default is 0.8.
color (str, optional) – The color of the quiver arrows. Default is ‘black’.
width (Real, optional) – The width of the quiver arrows. Default is 0.002.
channel (Integral, optional) – The channel of the images to display if they are multi-channel. Default is 0.
- Return type:
None
See also
pycvcam.compute_optical_flowCompute the optical flow between two images using the DIS method of OpenCV.
pycvcam.display_optical_flowDisplay the optical flow overlaid on the given image using Matplotlib.
Examples
Create two example images and compute the optical flow between them.
import numpy
import cv2
from pycvcam import compute_optical_flow, display_optical_flow_quiver
from pycvcam import get_lena_image

# Create two example images
image1 = get_lena_image() # numpy array of shape (474, 474)

# cv2 distortion to create a second image
image2 = cv2.undistort(image1, cameraMatrix=numpy.array(
    [[300, 0, 237], [0, 300, 237], [0, 0, 1]]
), distCoeffs=numpy.array([-0.2, 0.1, 0, 0]))

# Compute optical flow
flow_x, flow_y = compute_optical_flow(image1, image2)

# Select a region of interest (optional)
display_region = (10, 10, image1.shape[1]-20, image1.shape[0]-20) # (x, y, width, height)

# Display the optical flow as quiver plot
display_optical_flow_quiver(image1, image2, flow_x, flow_y, display_region=display_region)
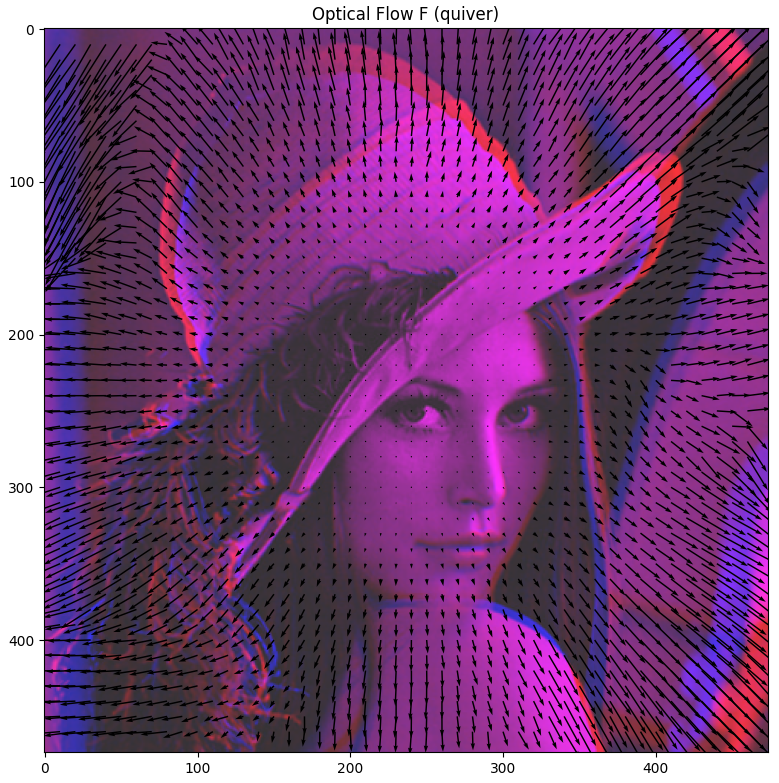
Example of optical flow quiver plot visualization using display_optical_flow_quiver.#