pycvcam.display_optical_flow#
- display_optical_flow(image, flow_x, flow_y, region=None, display_region=None, alpha=0.5, channel=0, norm_cmap='inferno', comp_cmap='bwr', norm_vmin=None, norm_vmax=None, comp_vmin=None, comp_vmax=None)[source]#
Display the optical flow overlaid on the given image using Matplotlib.
- Parameters:
image (ArrayLike) – The background image with shape \((H, W)\) or \((H, W, C)\).
flow_x (ArrayLike) – The x-component of the optical flow (horizontal displacement) in pixels with shape \((H, W)\).
flow_y (ArrayLike) – The y-component of the optical flow (vertical displacement) in pixels with shape \((H, W)\).
region (Optional[Tuple[Integral, Integral, Integral, Integral]], optional) – A tuple specifying the region of interest in the format (x, y, width, height). Crop the image to this region before displaying. If None, the entire image is displayed. Default is None.
display_region (Optional[Tuple[Integral, Integral, Integral, Integral]], optional) – A tuple specifying the region of the flow to display in the format (x, y, width, height). Crop the flow to this region before displaying. If None, the entire flow is displayed. Default is None.
alpha (Real, optional) – The alpha blending value for overlaying the optical flow on the image. Default is 0.5.
channel (Integral, optional) – The channel of the image to display if it is multi-channel. Default is 0.
norm_cmap (
str, optional) – The colormap for the flow magnitude. Default is ‘inferno’.comp_cmap (
str, optional) – The colormap for the flow components. Default is ‘bwr’.norm_vmin (Optional[Real], optional) – Minimum value for flow magnitude colormap normalization. Default is None.
norm_vmax (Optional[Real], optional) – Maximum value for flow magnitude colormap normalization. Default is None.
comp_vmin (Optional[Real], optional) – Minimum value for flow component colormap normalization. Default is None.
comp_vmax (Optional[Real], optional) – Maximum value for flow component colormap normalization. Default is None.
- Return type:
None
See also
pycvcam.compute_optical_flowCompute the optical flow between two images using the DIS method of OpenCV.
pycvcam.display_optical_flow_quiverDisplay the optical flow as a quiver plot overlaid on the given images using Matplotlib.
Examples
Create two example images and compute the optical flow between them.
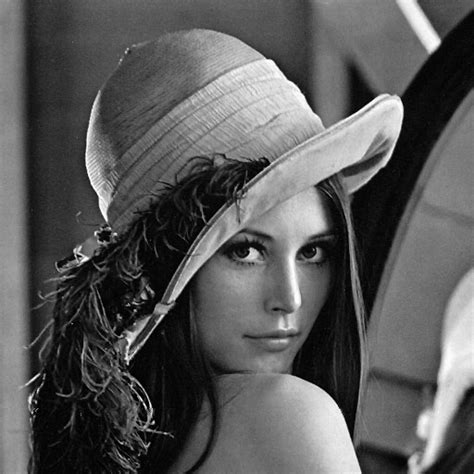
Lena image used for the example.#
 1import numpy
 2import cv2
 3from pycvcam import compute_optical_flow, display_optical_flow
 4from pycvcam import get_lena_image
 5
 6# Create two example images
 7image1 = get_lena_image() # numpy array of shape (474, 474)
 8
 9# cv2 distortion to create a second image
10image2 = cv2.undistort(image1, cameraMatrix=numpy.array(
11    [[300, 0, 237], [0, 300, 237], [0, 0, 1]]
12), distCoeffs=numpy.array([-0.2, 0.1, 0, 0]))
13
14# Compute optical flow
15flow_x, flow_y = compute_optical_flow(image1, image2)
16
17# Select a region of interest (optional)
18display_region = (10, 10, image1.shape[1]-20, image1.shape[0]-20) # (x, y, width, height)
19
20# Display the optical flow
21display_optical_flow(image1, flow_x, flow_y, display_region=display_region)
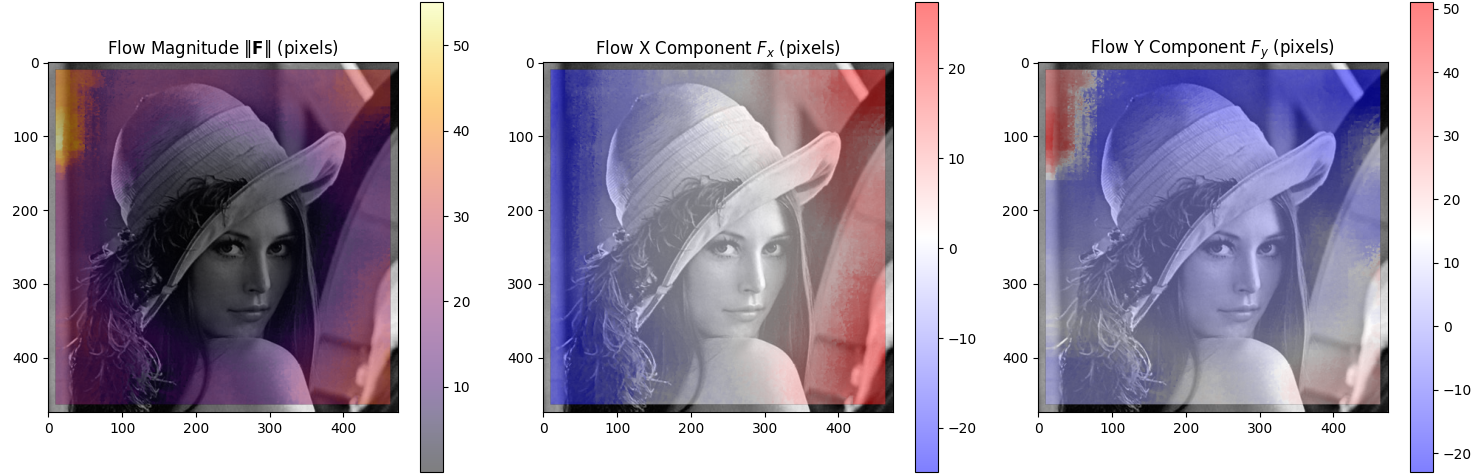
Example of optical flow visualization using display_optical_flow.#