pysdic.compute_neighborhood_statistics#
- compute_neighborhood_statistics(property_array, neighborhood, statistics, integrated_property=False)[source]#
Compute the specified statistics for the given property array defined at the vertices of a graph (or integration points) based on the neighborhood information for each vertex.
This function allows you to compute various statistics (e.g., mean, median, min, max, std) for a property defined at the vertices/elements of a mesh, using the values of the property from neighboring vertices/elements as defined in the neighborhood list. For each vertex/element, we will gather the values of the specified property from its neighboring vertices/elements and then compute the specified statistics to obtain a new array containing the computed statistics for each vertex/element.
Implemented statistics include:
Statistic
Description
meanCompute the mean of the property values from the neighbors.
medianCompute the median of the property values from the neighbors.
minCompute the minimum of the property values from the neighbors.
maxCompute the maximum of the property values from the neighbors.
stdCompute the standard deviation of the property values from the neighbors.
varCompute the variance of the property values from the neighbors.
Q1Compute the first quartile (25th percentile) of the property values from the neighbors.
Q3Compute the third quartile (75th percentile) of the property values from the neighbors.
IQRCompute the interquartile range (IQR) of the property values from the neighbors, defined as Q3 - Q1.
Note
The property array is converted to a 2D array of shape \((N, P)\) with type
numpy.float64to ensure consistent processing, where \(N\) is the number of vertices/elements and \(P\) is the number of properties per vertex/element. The computation will be done independently for each property if multiple properties are provided (i.e., if \(P > 1\)), and the resulting array will have the same shape \((N, P)\) containing the computed statistics values for each vertex/element and each property.Note
If a vertex/element has no neighbors (i.e., the corresponding sequence in the neighborhood list is empty), the computed statistics for that vertex/element will be set to
numpy.nanfor all properties, since there are no values to compute the statistics from.- Parameters:
property_array (ArrayLike) – An array of shape \((N, P)\) containing the property values defined at the vertices/elements of the mesh. If 1D-array is provided, it will be treated as a single-component property of shape \((N, 1)\).
neighborhood (List[List[
int]]]) – A list of sequences, where each sequence contains the indices of neighboring vertices/elements for each vertex/element in the mesh. The length of the list should be equal to the number of vertices/elements, and each sequence should contain the indices of the neighbors for the corresponding vertex/element.statistics (Union[
str, Sequence[str]]) – A string or a sequence of strings specifying the statistics(s) to compute for each vertex/element based on its neighbors.integrated_property (
bool, optional) – IfTrue, enlarge the function to accept properties defined at the integration points of a mesh and compute the specified statistics for each vertex/element based on the values of the property at the integration points of its neighboring elements. See the note below for more details. By defaultFalse.
- Returns:
A dictionary where the keys are the names of the computed statistics and the values are arrays of shape \((N, P)\) containing the computed statistics values for each vertex/element and each property.
- Return type:
Dict[
str,numpy.ndarray]
Notes
By default, the function is designed to compute statistics for properties defined at the vertices/elements of a mesh based on the neighborhood information for vertices/elements. In this case, the property array should have a shape of \((N, P)\), where \(N\) is the number of vertices/elements and \(P\) is the number of properties per vertex/element. The neighborhood list should be a list of sequences containing the indices of neighboring vertices/elements for each vertex/element in the mesh with a length equal to \(N\). The output will be a dictionary where each key is the name of the computed statistics and the corresponding value is an array of shape \((N, P)\) containing the computed statistics values for each vertex/element and each property.
However, if the parameter
integrated_propertyis set toTrue, the function can also accept properties defined at the integration points of a mesh and compute the specified statistics for each vertex/element based on the values of the property at the integration points of its neighboring elements. In this case, the property array should have a shape of \((N_{ip}, P)\), where \(N_{ip}\) is the total number of integration points in the mesh and \(P\) is the number of properties per integration point. And the neighborhood list should be a list of sequences containing the indices of the integration points that belong to the neighboring elements for each vertex/element in the mesh with a length equal to \(N\), where \(N\) is the number of vertices/elements in the mesh. The output will still be a dictionary where each key is the name of the computed statistics and the corresponding value is an array of shape \((N, P)\) containing the computed statistics values for each vertex/element and each property, but the computation will be based on the values of the property at the integration points of the neighboring elements for each vertex/element in the mesh.Examples
Create a simple disconnected graph of 7 vertices and compute the mean value of a property defined at the vertices of the graph.
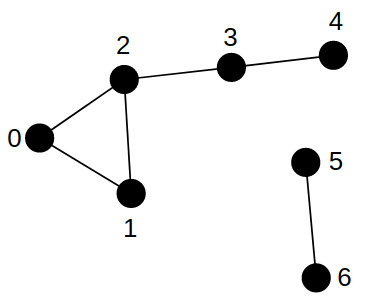
Disconnected graph with 7 vertices for BFS example.#
 1from pysdic import (
 2    compute_neighborhood,
 3    compute_neighborhood_statistics
 4)
 5
 6graph = [[1, 2], [0, 2], [0, 1, 3], [2, 4], [3], [6], [5]]
 7vertices_neighborhood = compute_neighborhood(
 8    graph, max_distance=2, self_neighborhood=True
 9)
10
11# Define a property array with values for each vertex in the graph
12temperature = [10.0, 20.0, 30.0, 40.0, 50.0, 60.0, 70.0]
13
14statistics = compute_neighborhood_statistics(
15    property_array=temperature,
16    neighborhood=vertices_neighborhood,
17    statistics=["mean", "median", "min", "max", "std"]
18)
19
20print("Minimum temperature in the neighborhood of each vertex:")
21print(statistics["min"].reshape(-1)) # Reshape to 1D array for better display
22print("Maximum temperature in the neighborhood of each vertex:")
23print(statistics["max"].reshape(-1)) # Reshape to 1D array for better display
24print("Mean temperature in the neighborhood of each vertex:")
25print(statistics["mean"].reshape(-1)) # Reshape to 1D array for better display
Minimum temperature in the neighborhood of each vertex:
[10. 10. 10. 10. 30. 60. 60.]
Maximum temperature in the neighborhood of each vertex:
[40. 40. 50. 50. 50. 70. 70.]
Mean temperature in the neighborhood of each vertex:
[25. 25. 30. 30. 40. 65. 65.]